Data-Driven Workforce Decisions
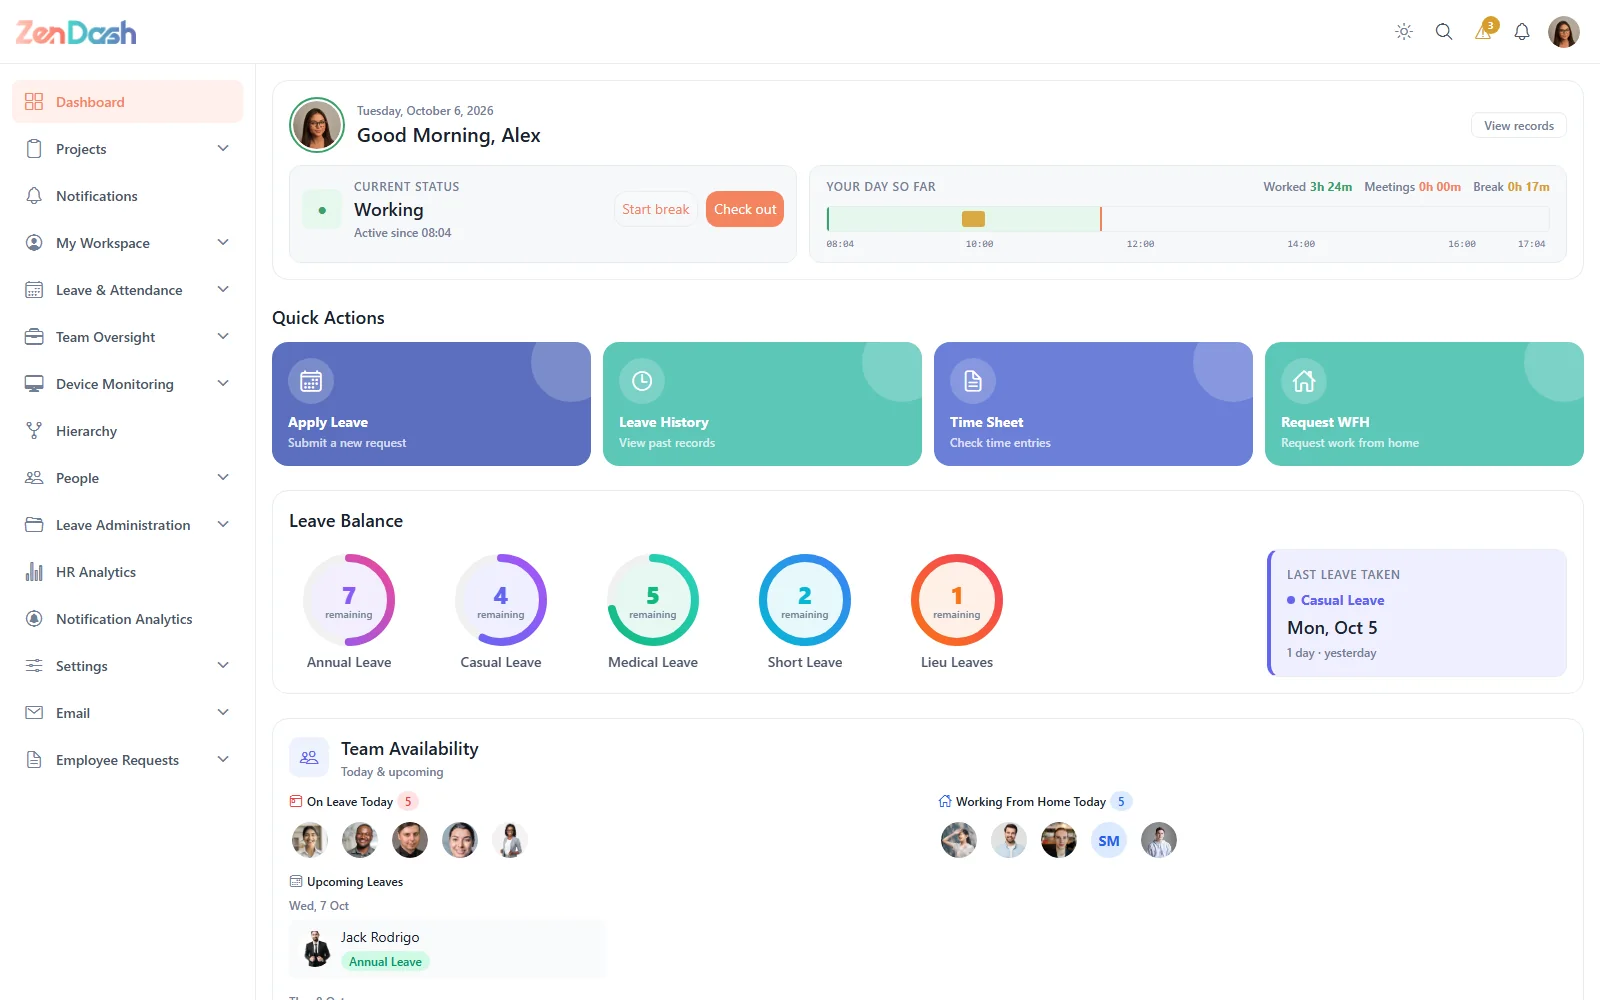
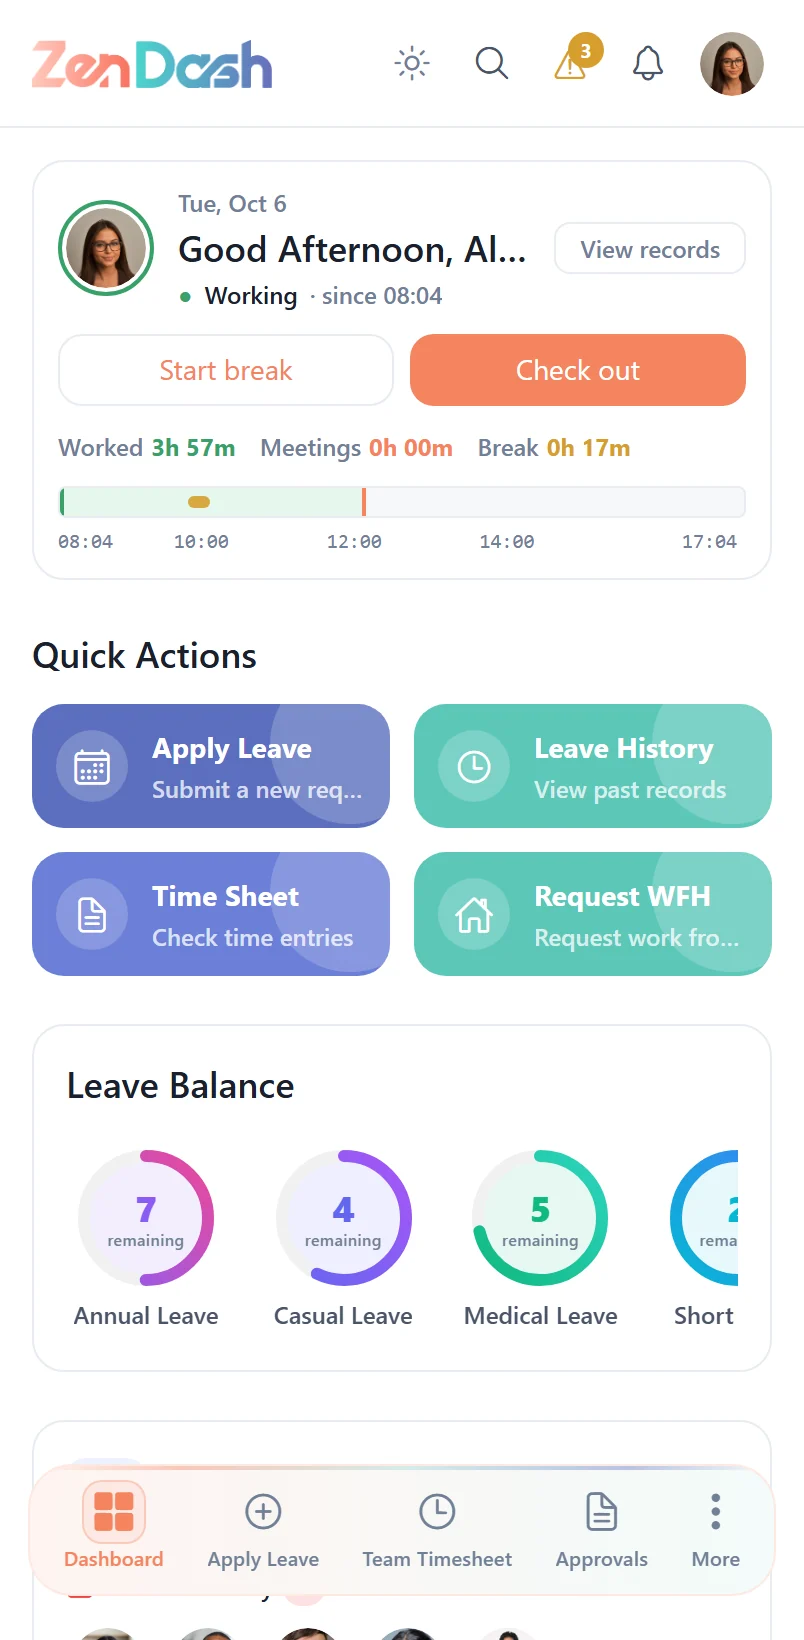
Interactive dashboards with real-time insights that help you understand workforce trends, optimize resource allocation, and make informed HR decisions.
Workforce Overview
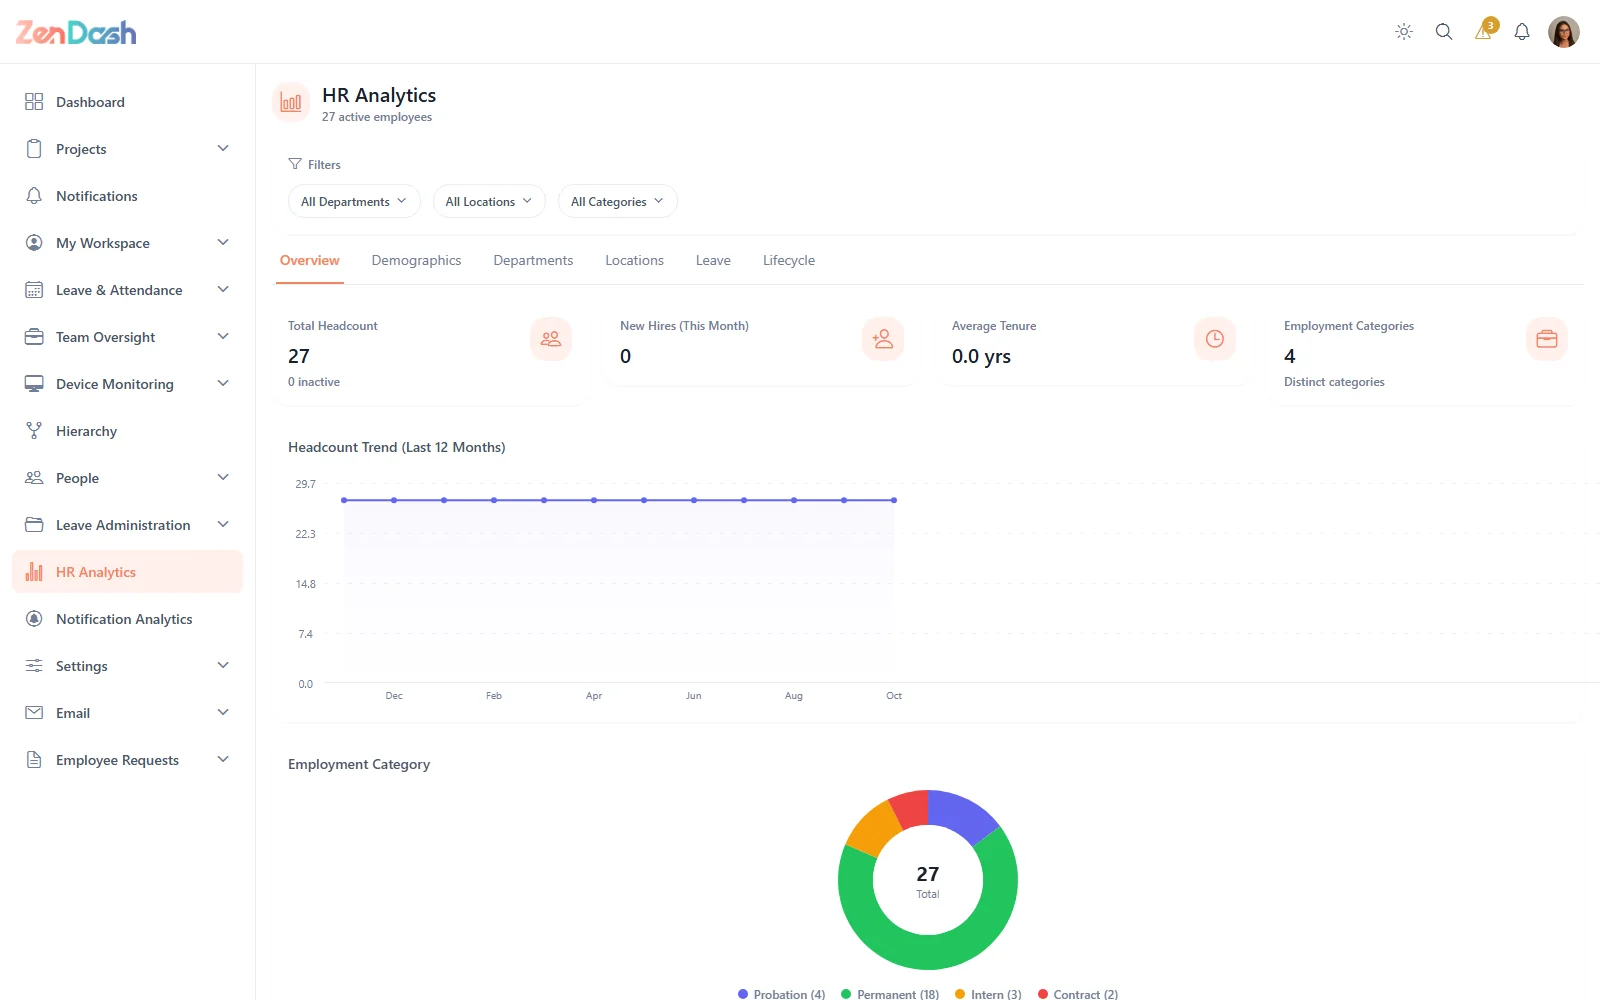
Get a bird's-eye view of your entire workforce with comprehensive headcount metrics and interactive visualizations.
- Real-time headcount metrics with trend indicators
- Employee distribution charts by department, location, and category
- Key metrics cards for quick organizational health checks
- Global filters by department, location, and employee category
Demographics & Tenure
Understand the composition of your workforce with detailed demographic breakdowns and tenure analysis.
- Age and gender distribution visualizations
- Tenure progression analysis across the organization
- Education level breakdown by department and role
- Designation and role distribution insights
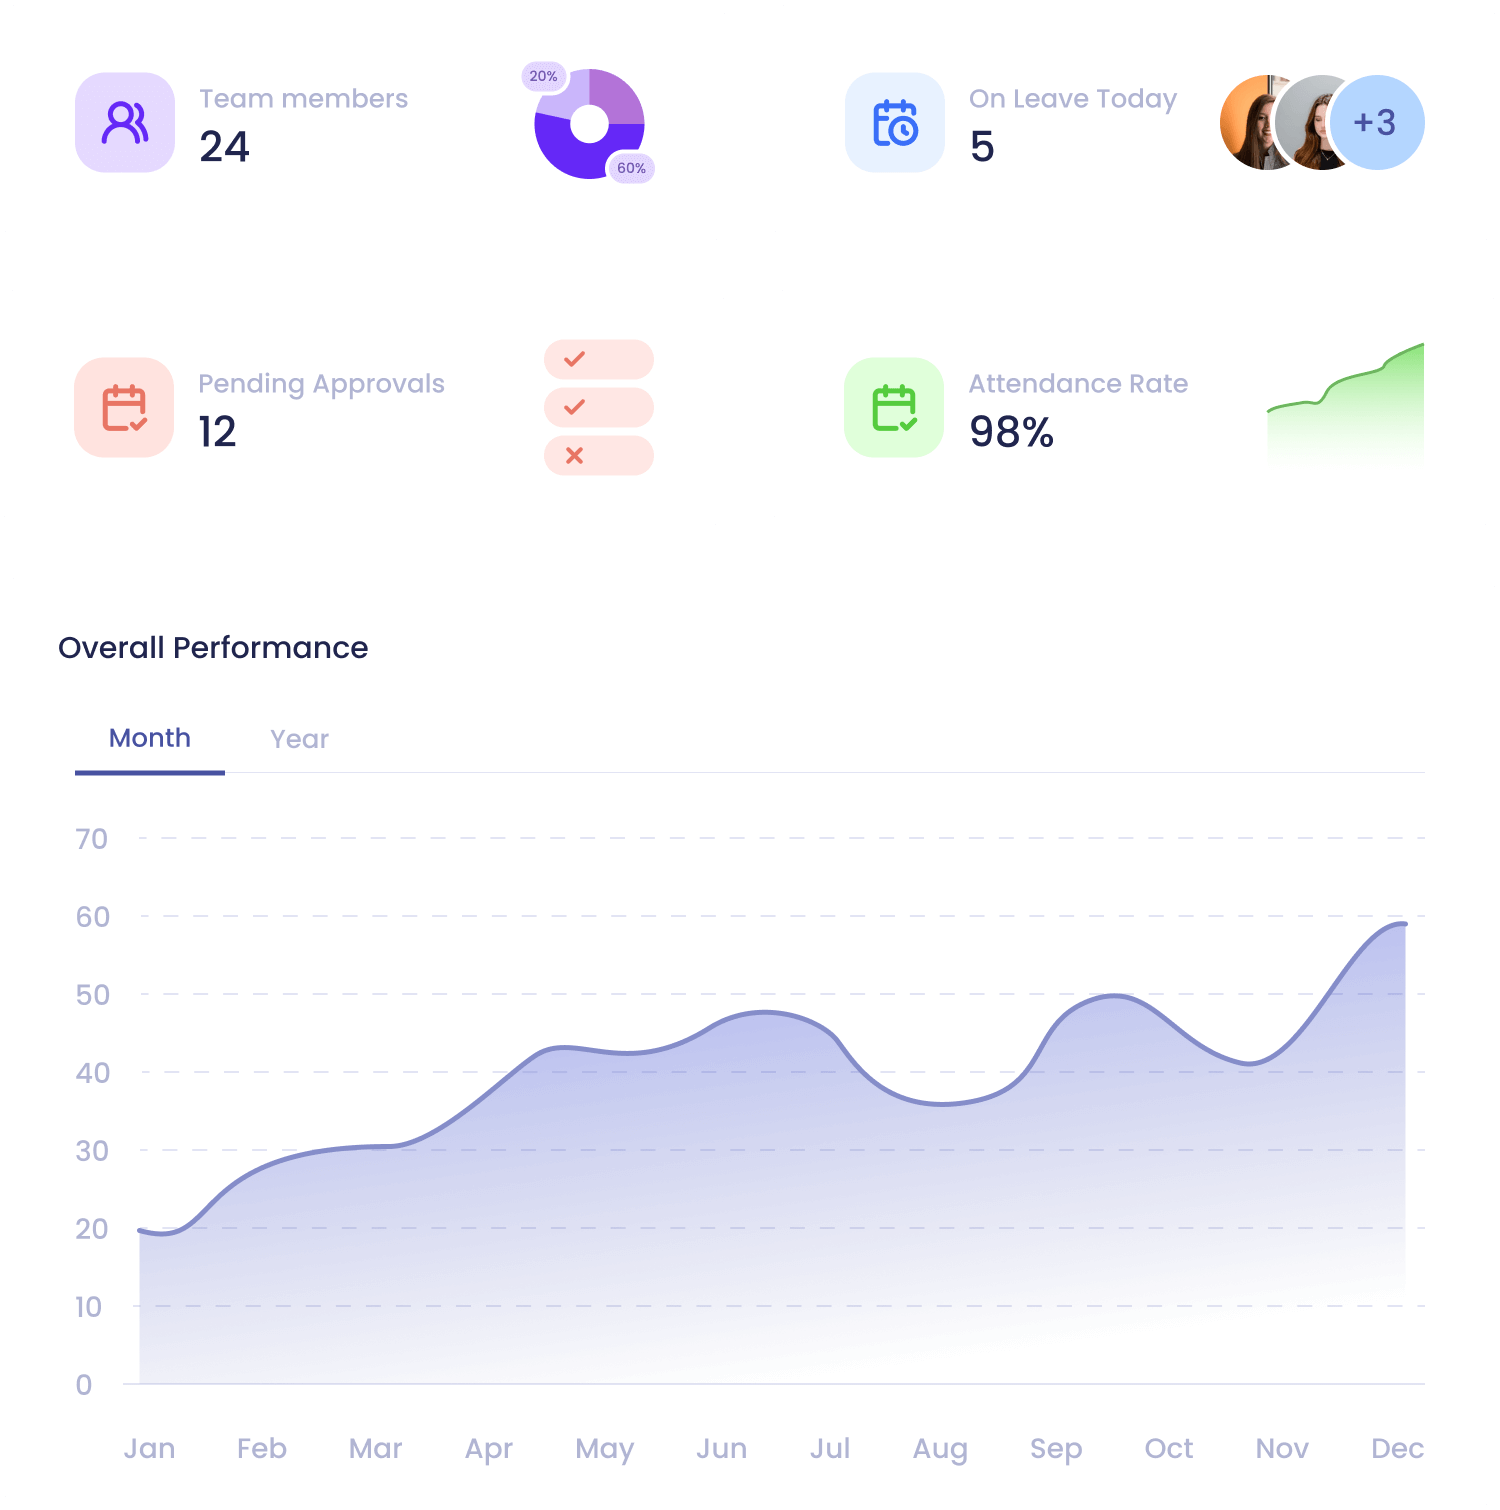
Department & Location Insights
Compare performance and composition across departments and locations to identify patterns and opportunities.
- Side-by-side department comparisons with key metrics
- Headcount trends by department over time
- Location distribution with geographic visualizations
- Remote vs office ratios and hybrid work analytics
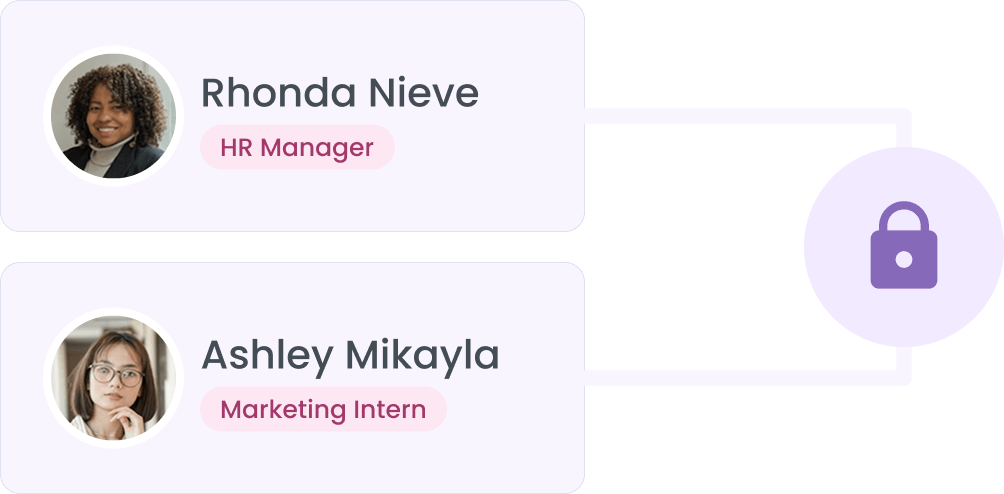
Leave Analytics
Analyze leave patterns across your organization to optimize policies and ensure adequate coverage.
- Leave usage trends over time with seasonal patterns
- Department-level leave patterns and comparisons
- Balance analysis by leave type and employee group
- Utilization breakdown to identify policy improvements

Employee Lifecycle
Track the complete employee journey from hiring to separation with actionable lifecycle analytics.
- Hiring trends with joiner analysis by period and source
- Separation and attrition analysis with reason breakdowns
- Tenure progression tracking across departments
- Lifecycle stage distribution for workforce planning
Notification Analytics
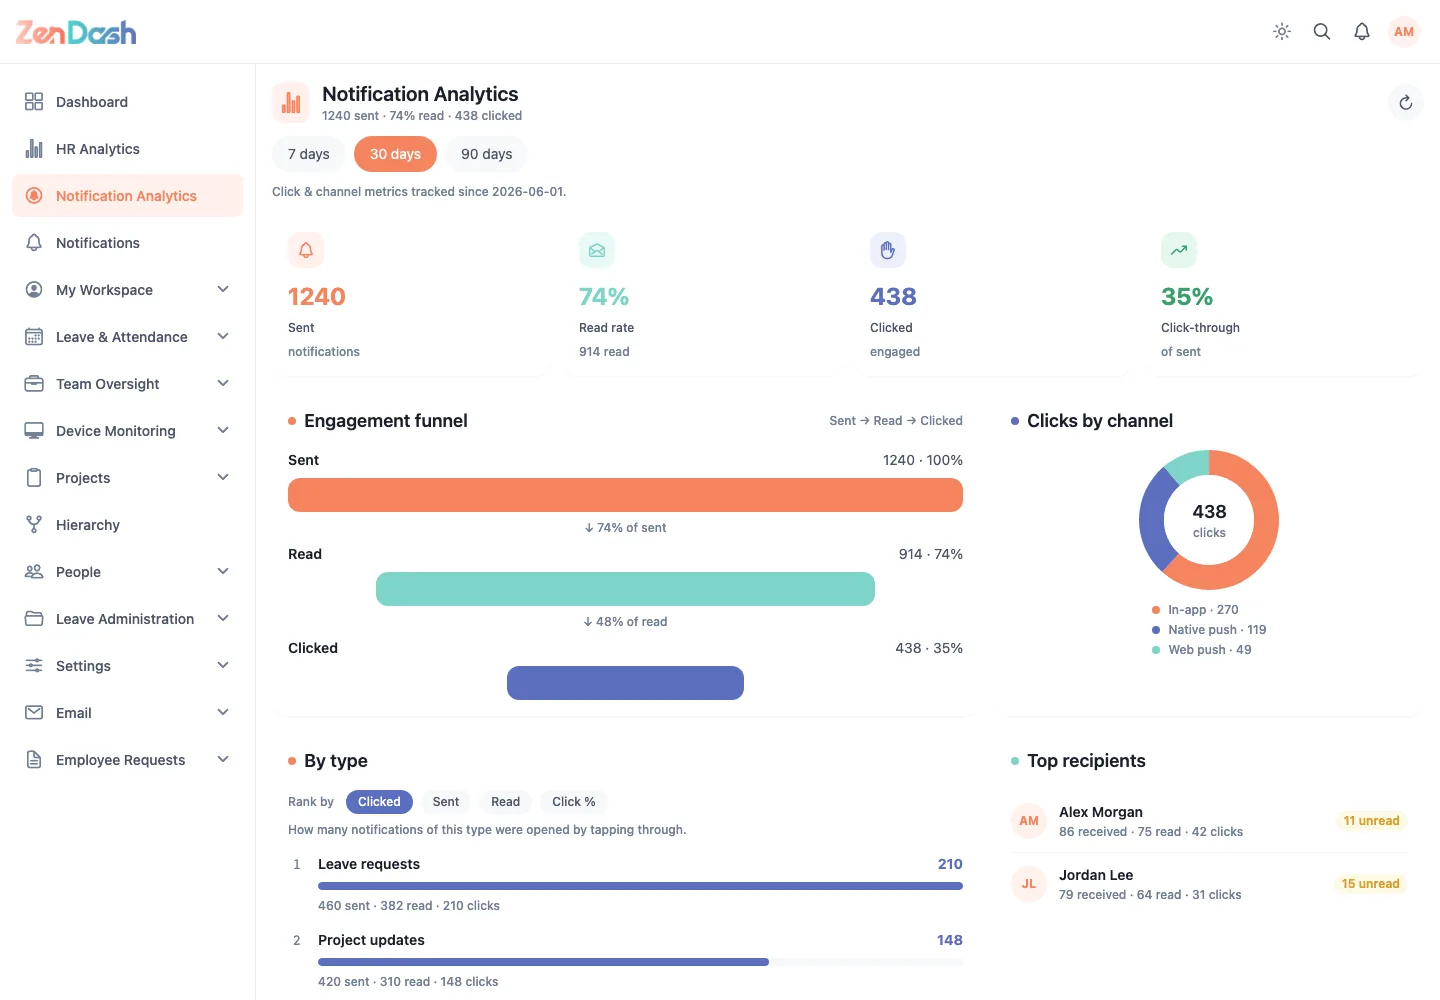
See whether your announcements, approvals and reminders actually reach people, and what they do next.
- Sent, read rate, clicked and click-through over 7, 30 or 90 days
- Engagement funnel from sent to read to clicked
- Clicks by channel and performance by notification type
- Top recipients and activity over time
Team Availability & Timesheets
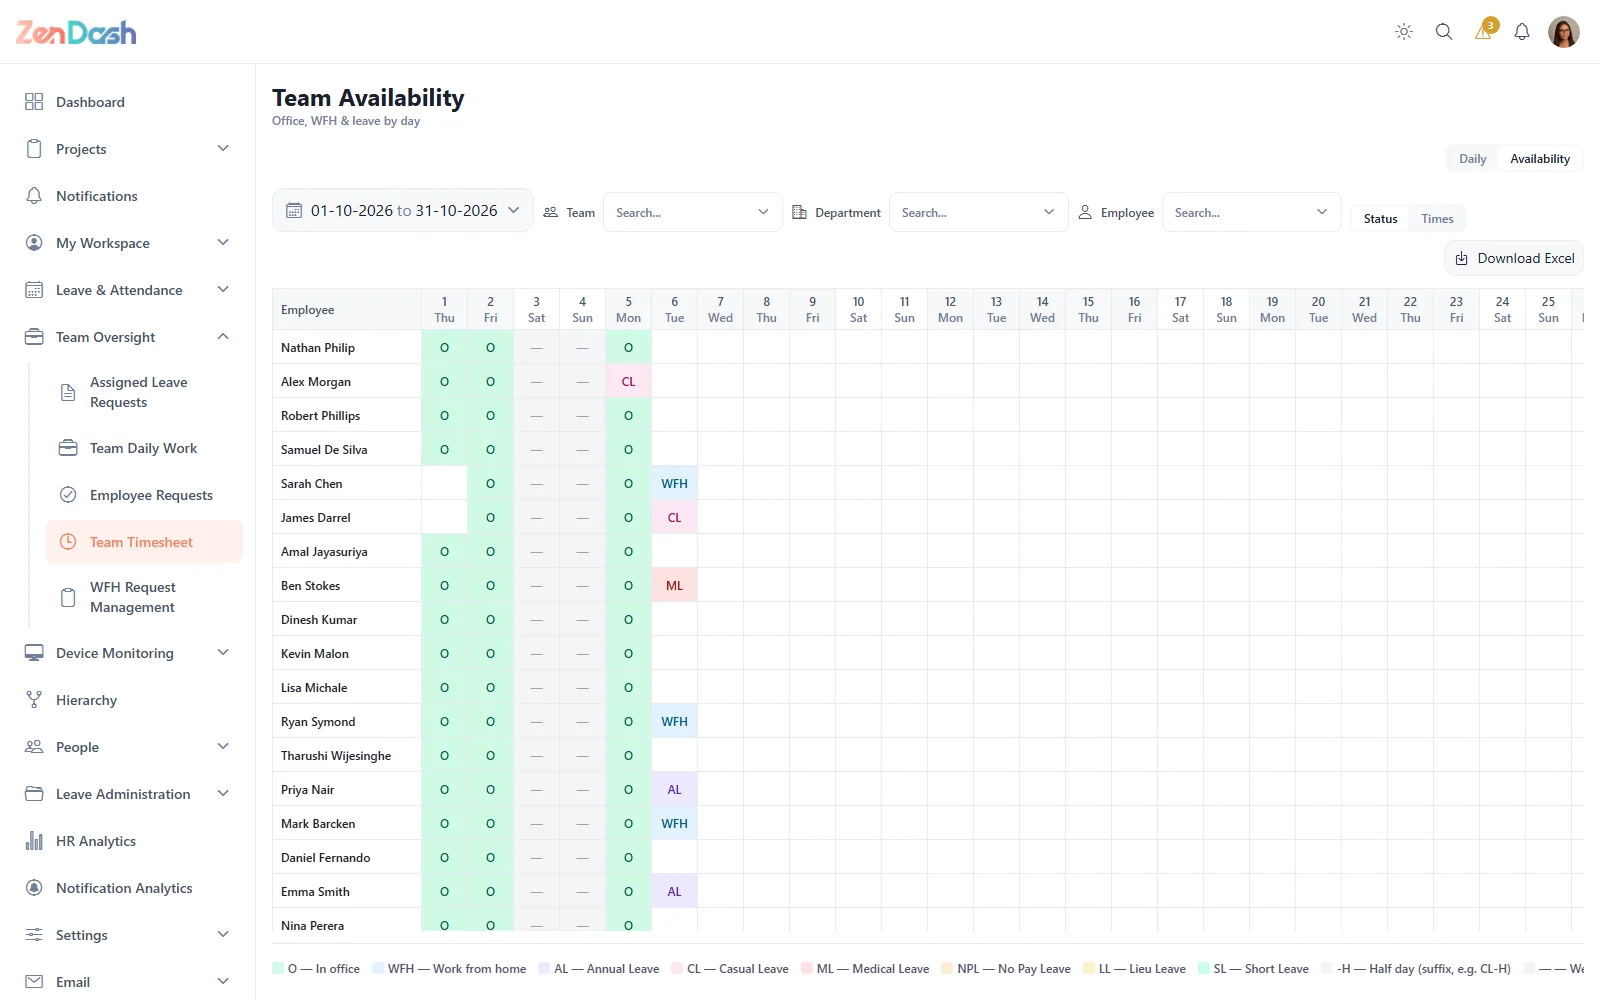
Turn attendance data into a clear picture of who is available and how time is being spent.
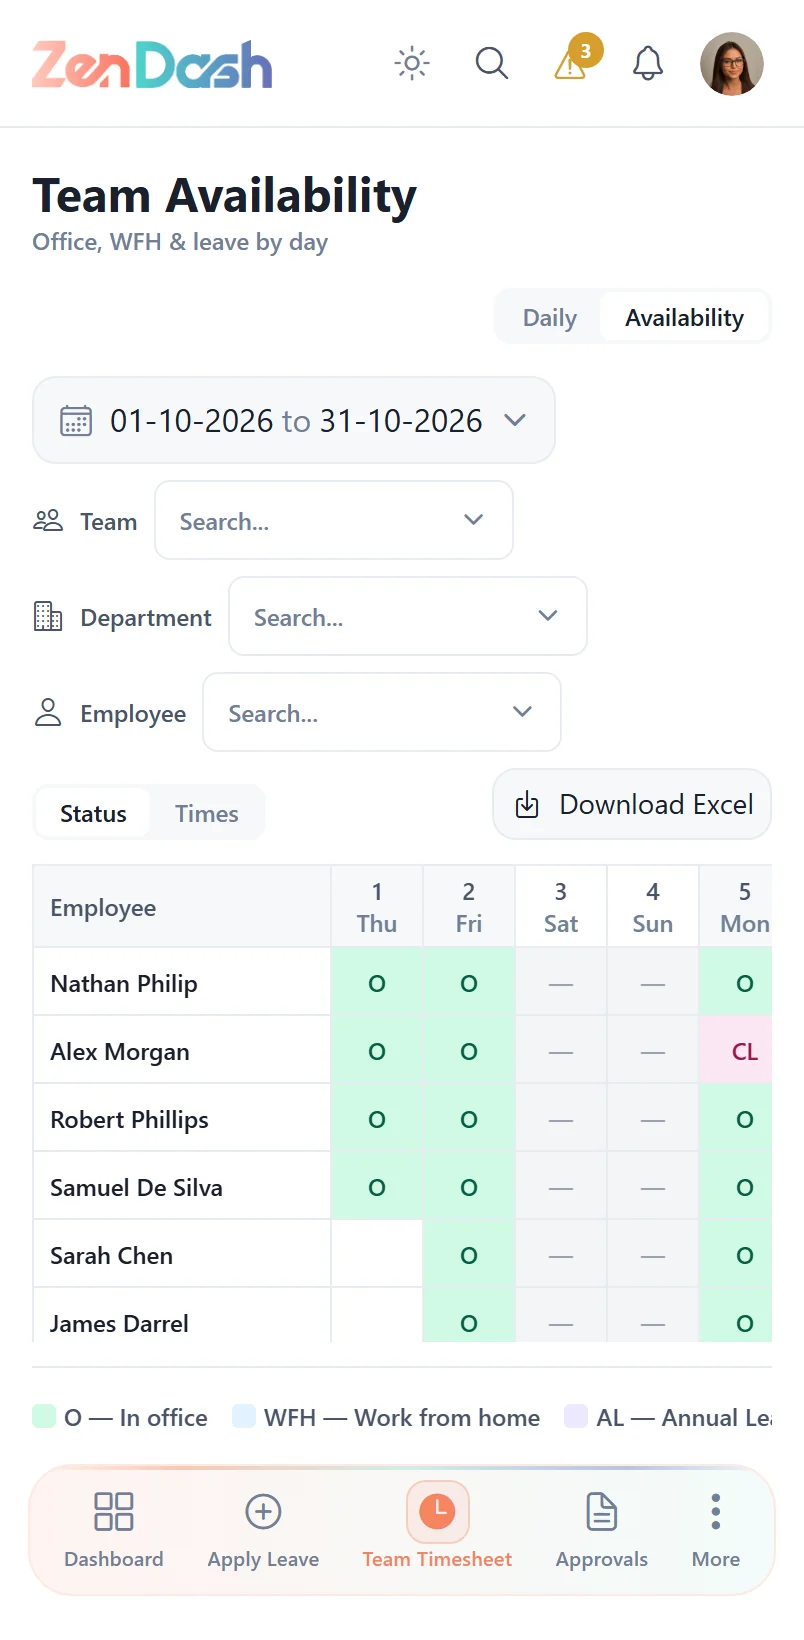
- Availability across a date range: office, WFH or leave
- Filter by team, department or employee
- Download availability to Excel
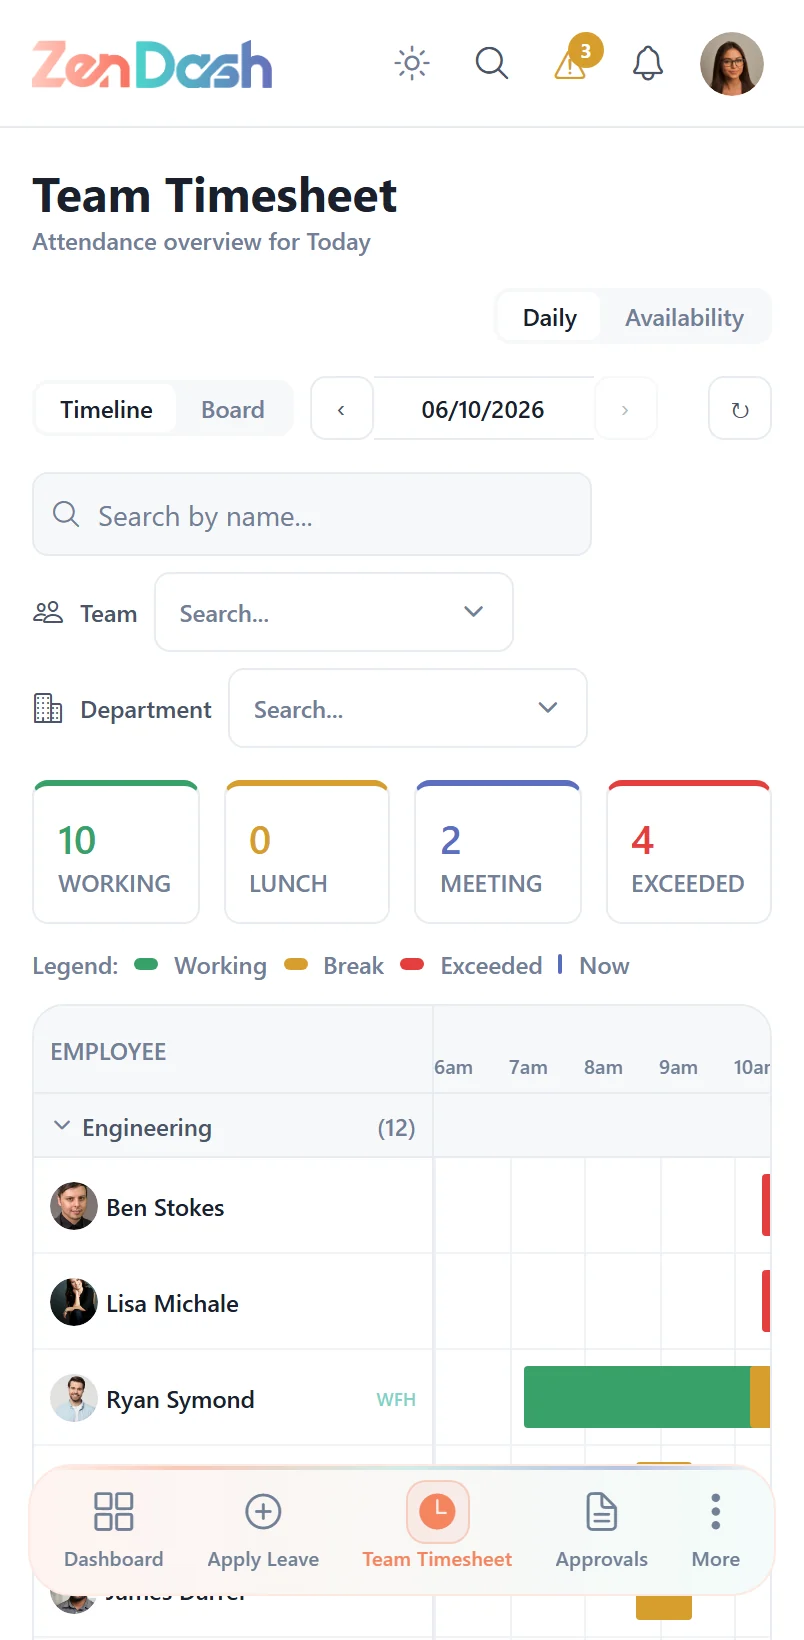
- Team Timesheet timeline of working, break and meeting time
Reports Ready To Share
Download the numbers your leadership asks for, with no spreadsheets to assemble.
Task Status Report
Project task and progress status as of any date, in Excel and PDF.
Tasks Completion Summary
What came in, what was finished and what is still open for any week, as a PDF.
Project & Attendance Reports
Project-first task reports and attendance reports, each in PDF and Excel.
Appraisals Export
Download appraisals for a date range to Excel.
Leave Quota Summary
Leave balances across the company, with an export.
Availability Export
Team availability for any date range, downloaded to Excel.
Insights Wherever You Are
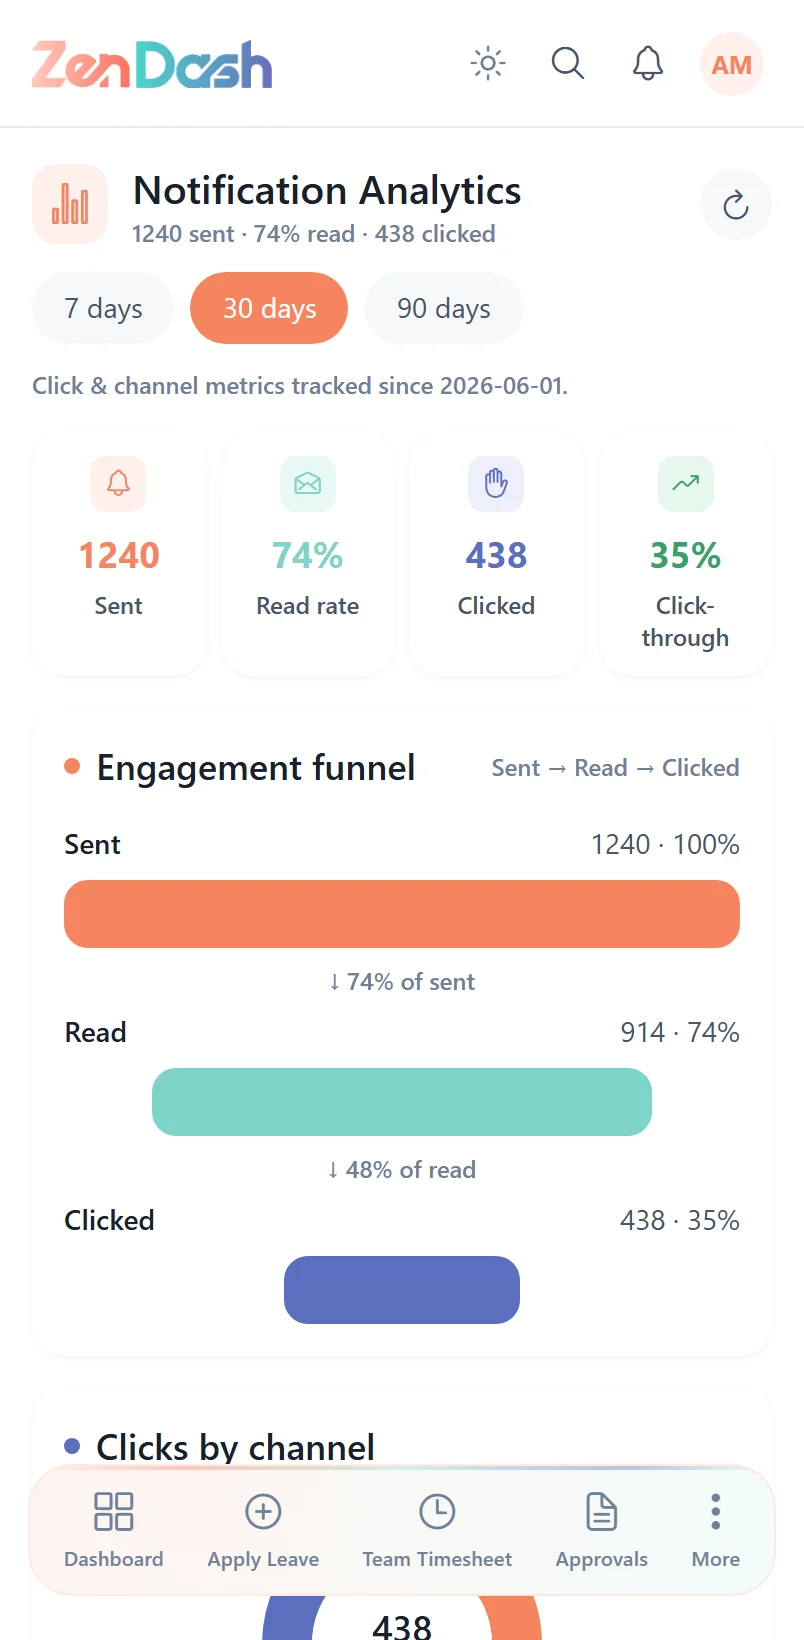
Analytics and team views work just as well on a phone.
- Notification engagement at a glance
- Team availability for the week ahead
- Team Timesheet on the go
- Available on
- Web
- iOS
- Android
Works Together With
Every module shares the same people and data, so you run your whole workforce from one place.